2026 Best Smart Solar Savings Solutions for Global Buyers
The 2026 Best Smart Solar Savings Solutions for Global Buyers guide examines practical ways to reduce energy costs with modern solar technology. It considers rooftop photovoltaic systems, battery storage, smart inverters, monitoring software, and flexible financing. Each solution can perform differently under local sunlight, electricity prices, taxes, grid rules, and installation standards.
Fatih Birol, Executive Director of the International Energy Agency, said, “Solar is the new king of electricity markets.” His observation reflects a major market shift. Solar power is no longer limited to experimental projects or wealthy households. It now supports factories, farms, offices, apartment buildings, and remote communities. Smart solar savings, however, requires more than buying the cheapest panels. Buyers should compare annual yield, degradation rates, battery cycling, warranty terms, installer experience, and after-sales support. A low purchase price can hide expensive replacements.
Real-world details matter. A family may need evening battery capacity after cooking and heating demand rise. A warehouse may gain more from daytime solar than from a large battery. A cloudy coastal region may need different equipment than a dry, high-sun location. These choices deserve professional assessment and transparent calculations.
No global solution fits every buyer. Forecasts can also prove imperfect. Utility prices change, equipment supply can weaken, and installation quality varies sharply. This guide therefore emphasizes evidence, verified specifications, credible suppliers, and realistic payback expectations. It also encourages readers to question attractive savings claims before signing a contract. Good solar decisions are measured over years, not through optimistic promises made in one sales meeting.
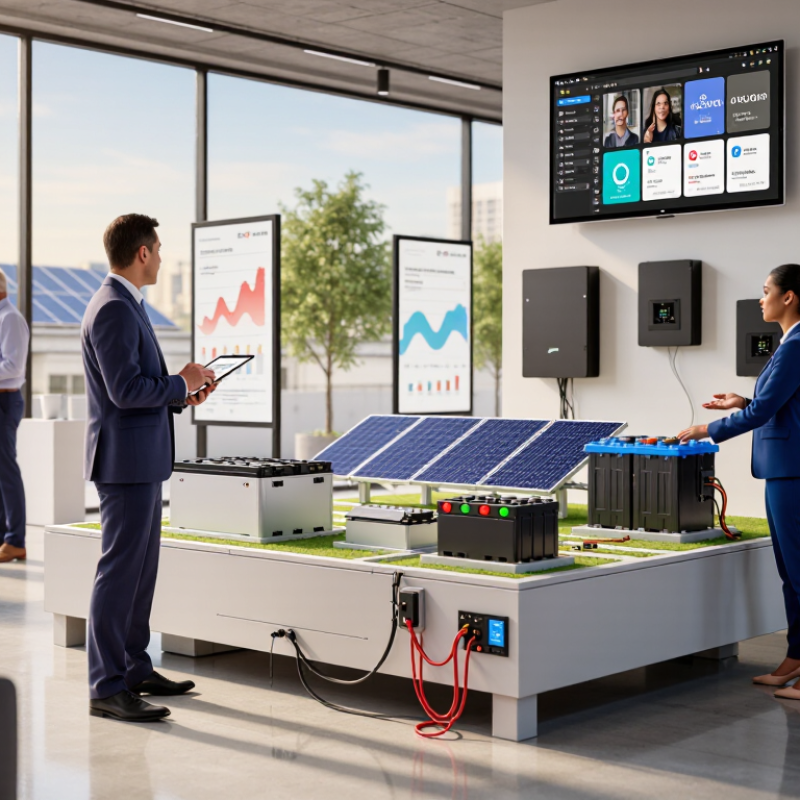
Global Solar Baseline: Over 2.2 TW of PV Capacity by 2024 (IEA PVPS)
Global solar has entered a practical scale. The IEA PVPS reports more than 2.2 terawatts of photovoltaic capacity worldwide by 2024. That number represents millions of rooftops, solar farms, and distributed systems. It also shows why smart solar savings solutions matter to global buyers.
A smart system can combine photovoltaic panels, battery storage, load control, and live monitoring. For a household, software may shift water heating to sunny hours. For a factory, it can reduce peak demand during expensive evening periods. A buyer should check local sunlight, electricity tariffs, grid rules, and battery recycling options. These details often change the expected payback.
Use measured data, not impressive estimates. Ask for production records from similar installations and examine warranty conditions carefully. An independent installer can verify roof strength, wiring, protection devices, and maintenance access. Savings are not automatic. A shaded roof, poor settings, or an oversized battery can weaken results. I have seen forecasts look precise while ignoring seasonal clouds and changing tariffs. That is a useful warning. Global capacity proves solar’s momentum, but each project still needs local evidence, transparent calculations, and realistic operating assumptions.
| Solution / Data Dimension | Verified Global Baseline or Technical Range | How It Improves Savings | Best-Fit Buyer Profile | Reference |
|---|---|---|---|---|
| Global solar PV market | >2.2 TW of cumulative PV capacity was installed worldwide by the end of 2024. | A larger installed base supports wider availability of installers, financing models, spare parts, and standardized system designs. | International buyers comparing residential, commercial, utility-scale, and hybrid solar projects. | IEA PVPS, Trends in Photovoltaic Applications 2025 |
| Solar electricity generation | Solar PV supplied approximately 7% of global electricity generation in 2024. | Solar can reduce purchases of grid electricity and lower exposure to variable retail electricity prices, subject to local tariffs and system output. | Commercial facilities, public buildings, farms, warehouses, and households with suitable solar resources. | IEA, Renewables 2024; IEA, Global Energy Review 2025 |
| High-efficiency PV modules | Commercially available crystalline-silicon modules commonly provide approximately 20%–23% module efficiency, depending on cell architecture and product design. | Higher efficiency produces more power from limited roof or land area and can reduce balance-of-system costs per watt. | Urban rooftops, constrained commercial sites, carports, and projects where usable area is limited. | Fraunhofer ISE, Photovoltaics Report 2025; NREL Best Research-Cell Efficiencies |
| Grid-connected rooftop PV | A properly sized system can offset a substantial share of annual electricity consumption; actual savings depend on solar irradiation, load profile, tariffs, export rules, and shading. | Self-consumed solar electricity generally avoids the retail electricity rate, while exported electricity is compensated according to local policy or contract terms. | Homes and small businesses with daytime or flexible electricity demand. | IEA PVPS, Trends in Photovoltaic Applications 2025; IEA, Renewables 2024 |
| Smart energy monitoring | Interval monitoring can provide load, solar-generation, battery-state, and export data at sub-hourly or hourly resolution, depending on the meter and platform. | Identifies standby loads, production losses, abnormal inverter behavior, and opportunities to shift consumption into solar-generation hours. | Buyers seeking transparent performance verification and lower operating losses. | IEC 61724-1:2021, Photovoltaic System Performance Monitoring |
| Lithium-ion battery storage | Typical battery round-trip efficiency is approximately 85%–95%; usable capacity, temperature, charge rate, and operating strategy affect results. | Stores excess midday solar for evening use, increases self-consumption, and may reduce demand charges where tariff structures allow it. | Sites with evening loads, time-of-use tariffs, grid-export limits, or backup-power requirements. | U.S. Department of Energy, Energy Storage Technology and Cost Characterization Reports; NREL, Annual Technology Baseline |
| Solar-plus-storage control | Energy-management systems can prioritize solar self-consumption, battery charging, backup reserve, or export according to programmed rules and electricity prices. | Reduces avoidable grid imports by coordinating PV, battery storage, flexible loads, and tariff periods. | Commercial and residential buyers with dynamic tariffs or high evening electricity consumption. | U.S. Department of Energy, Grid-Interactive Efficient Buildings; IEA, Batteries and Secure Energy Transitions 2024 |
| Time-of-use load shifting | Flexible loads such as water heating, electric-vehicle charging, cooling, and pumping can be scheduled during periods of high solar output. | Raises direct solar consumption and can reduce purchases during higher-priced tariff periods without installing additional PV capacity. | Properties with controllable appliances, electric vehicles, thermal storage, or daytime operating hours. | IEA, Demand-Side Flexibility 2023; U.S. Department of Energy, Grid-Interactive Efficient Buildings |
| Solar-powered electric-vehicle charging | Charging during solar-production hours can directly use on-site PV electricity; charging results depend on vehicle size, charger rating, driving distance, and solar output. | Can replace higher-cost grid electricity or fuel purchases and can use an electric vehicle as a flexible load. | Homes, offices, logistics facilities, retail sites, and fleets with daytime parking. | IEA, Global EV Outlook 2025; U.S. Department of Energy, Alternative Fuels Data Center |
| Remote performance diagnostics | PV performance is commonly evaluated using energy yield, performance ratio, availability, and specific yield rather than installed capacity alone. | Early detection of shading, soiling, communication faults, inverter trips, and underperforming strings helps protect expected energy production. | Large rooftops, multi-site portfolios, commercial installations, and utility-scale plants. | IEC 61724-1:2021, Photovoltaic System Performance Monitoring |
| PV degradation planning | Crystalline-silicon PV systems are commonly modeled with annual degradation of approximately 0.25%–0.50%, although the actual rate varies by technology, climate, installation quality, and operating conditions. | Including degradation in financial models produces more realistic lifetime energy and payback calculations. | Buyers comparing long-term projects, power-purchase agreements, or assets with 20–30-year operating horizons. | Jordan and Kurtz, NREL, Photovoltaic Degradation Rates—An Analytical Review; IEC 61724-1:2021 |
| Lifecycle carbon benefit | Utility-scale solar PV has a much lower lifecycle greenhouse-gas intensity than fossil-fuel generation; published estimates vary by technology, location, and manufacturing assumptions. | Reduces operational emissions while supporting corporate renewable-electricity and emissions-reduction targets. | Organizations evaluating total cost of ownership together with environmental performance. | IPCC, AR6 WGIII, Chapter 6; NREL, Life Cycle Greenhouse Gas Emissions from Electricity Generation |
| Buyer evaluation metric | Use levelized cost of electricity, net present value, payback period, self-consumption ratio, battery round-trip efficiency, and annual degradation in the same model. | Provides a more reliable comparison than module price alone because installation, financing, maintenance, tariffs, exports, replacement, and lifetime output affect total savings. | Global buyers requesting comparable technical and financial bids from multiple markets. | IEA, Projected Costs of Generating Electricity 2020; NREL, Annual Technology Baseline |
Important: Actual savings are location-specific and should be calculated using local solar irradiation, electricity tariffs, export compensation, system size, financing costs, installation conditions, maintenance assumptions, and applicable taxes or incentives.
Related Posts
-

How to Choose the Best Portable Solar Panels for Camping and Outdoor Use
-
2025 How to Build Your Own DIY Solar Panels for Home Energy Savings
-
Best Residential Solar Panels for Your Home in 2026?
-
Top Benefits of Installing Solar Panels for Homeowners in 2023
-
Why Choose DIY Solar Panels for Your Home?
-
Top Solar Panels for Home in 2025 Choosing the Best Options for Your Needs